Labor Productivity Revisited

In my April 2015 blog, A Few Notes on Labor Productivity, I discussed how productivity is defined by the US Bureau of Labor Statistics (BLS) and its potential impact on employment, inflation and economic growth. The blog emphasized that it is important to distinguish between the impacts of higher or lower productivity in the short run versus the longer term.
Labor productivity is defined as the total amount of output produced per hour of labor, and is reported quarterly for the US economy by the BLS. Some analysts have argued that technological changes are not accurately reflected in the productivity measure. Also, productivity growth can be volatile from quarter to quarter and is not as widely publicized as inflation or the unemployment rate. However, the overall rate of labor productivity growth in the economy is closely watched by market economists and the Federal Reserve.
When labor productivity is growing slowly or declining, this could actually be a signal that more workers are being hired. That is, the total number of hours worked is increasing, which reduces the denominator of the productivity equation (output/hours worked).1 In the short term, lower productivity can indeed signal new hiring. However, this lower productivity can ultimately lead to higher prices and higher inflation as businesses attempt to maintain their profit margins in the face of higher labor costs. In turn, this higher inflation may lead to higher interest rates, which slow the employment benefit of the lower productivity rates.
Another way of looking at this, is in the long term,
Economic Growth = Growth in Population + Growth in Productivity
Population growth in the US is slowing, as evidenced by lower birthrates and an aging population. Because of this, productivity must show a positive trend to maintain economic growth rates even at modest levels such as 2% per year.
What does the data show? The chart below shows quarterly growth rates in US productivity and total employment since 2005. Although the data has been volatile, declining productivity in a number of periods has been associated with higher employment growth and vice-versa, with a negative correlation of -0.28.

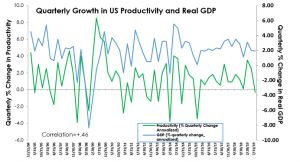
The next chart shows quarterly growth rates in US productivity and real GDP Growth. Here, the correlation is positive +0.46, with productivity and GDP growth moving in tandem. Note that during the financial crisis of 2008, plunging productivity was associated with a drop in GDP growth, while the recovery in late 2009 was highlighted by a significant positive spike in productivity.

In conclusion, government statistics on overall US productivity growth can be volatile and should be treated with caution. Lower productivity can be a signal of short run employment growth but could also portend higher inflation to come and lower economic growth rates. Conversely, increases in productivity could have longer term beneficial effects by moderating potential upticks in prices and maintaining steady growth. However, technology and automation can increase productivity and growth but can also create displacement of workers in a number of industries.
1.The numerator of the productivity equation, output, may also increase due to more hours worked, but we assume that this is a longer-term effect.NOTE: Information presented herein is for discussion and illustrative purposes only and is not a recommendation or an offer or solicitation to buy or sell any securities. Past performance is not a guarantee of future investment results.