Gross Domestic Product: What It Does and Doesn’t Tell Us

A blog by Frederic P. Slade, CFA, Assistant Vice President, Senior Director of Investments, Pentegra Retirement Services – September 22, 2015
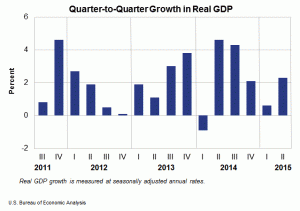
Gross Domestic Product (GDP) is considered the primary economic indicator of the well being of the United States economy. GDP is defined as the dollar value of goods and services produced in the national economy. GDP is measured quarterly by the Bureau of Economic Analysis (BEA) and is adjusted for inflation (this adjusted measure is known as “real GDP”). The current real GDP reported by the BEA is $16.3 trillion. However, the number that is most closely followed by investors and Wall Street is the annualized growth rate in real GDP. What is considered a normal growth rate? A positive real GDP growth rate between +2% and +4% is generally considered to be normal for the United States economy. If the real GDP growth rate is above 4%, the economy is considered to be accelerating; 0%-2% suggests a sluggish economy; a negative real GDP growth rate portends a possible recession if it persists. The most recent real GDP growth rate, for 2Q2015, was +2.3% (subsequently revised upward to +3.7%).

Is GDP a perfect measure of the economy’s well being? Definitely not, as there are items, both monetary and nonmonetary, that are not included in GDP. The most-discussed exclusion is the dollars generated by the underground economy. The underground economy includes legal as well as illegal activities where income is not reported and taxes are not paid. Examples of the underground economy are cash-only transactions and freelancing. How big is the underground economy? One estimate puts the size of the underground economy at $2 trillion, or about 12% of real GDP1. Another item not included in GDP is the dollar value of unpaid housework and child care. A 2012 study found that if housework was included, GDP would have been 26% higher in 20102.
What about items that, if included, would potentially subtract from real GDP? A prime example is air pollution and effects of global warming. A 2008 study estimated that global warming could could ultimately cost the United States economy nearly $300 billion by 2025.3 Another item not factored specifically into GDP is the distribution of national income among households. Some have argued that an unequal distribution of wealth lessens the quality of GDP.
It is not clear what the impact of including the above factors would be on the growth of real GDP. However, there is continued effort on the part of economists and the BEA to develop more comprehensive measures of the well-being of the United States economy.
1. Zeiler, David. Money Morning, April 29, 2013.
2. Benjamin Bridgman, Andrew Dugan, Mikhael Lal, Matthew Osborne and Shaunda Villones. “Accounting for Household Production in the National Accounts, 1965–2010”, Survey of Current Business, May 2012.
3. Frank Ackerman and Elizabeth A. Stanton. “The Cost of Climate Change”, NRDC, May 2008.
NOTE: Information presented herein is for discussion and illustrative purposes only and is not a recommendation or an offer or solicitation to buy or sell any securities. Past performance is not a guarantee of future results.
Comments
No comments.